Stocks staged a strong recovery in Q2, with the S&P 500 gaining +15% and finishing near record highs. The Middle East conflict and oil shock that started in Q1 continued for most of Q2, but oil prices fell as the two sides worked toward a ceasefire agreement. Meanwhile, investors' enthusiasm for artificial intelligence (AI) stocks returned, fueling a rally in semiconductor stocks. As companies reported strong Q1 earnings, the gains broadened beyond technology to include mid-and small-cap stocks.
Even as stocks rallied, market conditions continued to evolve. The spring rise in oil prices lifted inflation to a three-year high, and the Federal Reserve signaled a shift from rate cuts to rate hikes. In this letter, we recap the key developments in Q2, discuss the oil reversal and its impact on Fed policy, analyze the rally in semiconductor stocks, and look ahead to Q3.
The energy shock that started in Q1 unwound almost as fast as it arrived. Figure 1 shows oil peaked near $115 in early April as the Middle East conflict closed the Strait of Hormuz, disrupting global oil supply. Energy prices remained volatile throughout the quarter, but oil ended Q2 near $70, returning to where it traded when the conflict began. The decline followed a ceasefire between the U.S. and Iran and expectations for the Strait, which carries nearly 20% of the world's oil, to reopen. Gas prices followed the same path, rising sharply during the spring before falling in late Q2.
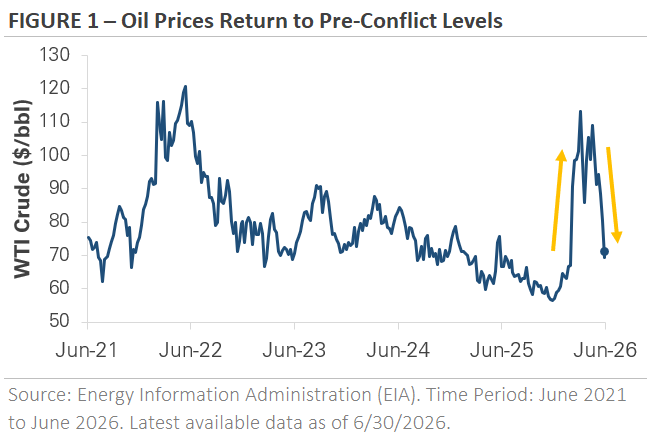
The price reversal matters because energy prices feed directly into inflation, which in turn shapes the outlook for interest rates. When oil spiked earlier this year, inflation followed. Consumer prices rose +4.2% year-over-year in May, the highest in three years, with over half of the monthly increase tied to energy. Excluding energy, the underlying rate was +2.9%, an indication that the rise in inflation was driven by oil rather than broad price pressures.
The oil price spike and the subsequent rise in inflation reshaped the interest rate outlook. Coming into this year, the market expected the Federal Reserve to cut interest rates two or three times. During Q2, the market swung from expecting rate cuts to pricing in a rate hike this fall. The Federal Reserve held interest rates steady at both of its meetings during Q2, but it leaned toward the market's view, signaling that its next move could be up rather than down.
The May inflation reading is backward-looking, so it captures oil near its peak rather than where it sits today. With oil back at pre-conflict levels, the main driver of higher inflation has started to fade, and inflation is expected to ease in the months ahead. What stands out for the full quarter is how the market handled the episode. There were stretches of volatility as the conflict dominated headlines in the spring, but stocks moved past them and finished Q2 higher.
Semiconductor stocks led the market's advance, posting their strongest quarter in nearly 30 years. The top chart in Figure 2 graphs the quarterly price return of the semiconductor stock index, with Q2 towering over nearly everything before it. The group returned +88% for the quarter and was up nearly +100% before pulling back in the final weeks of June. The only comparable quarters occurred in the late 1990s, when the internet went mainstream.
The rally is anchored to a wave of technology investment, with much of the money flowing to the chipmakers. The bottom chart graphs the combined capital spending of five of the largest tech companies building AI infrastructure: Microsoft, Amazon, Meta, Alphabet, and Oracle. The group spent a combined $32 billion in 2016. By 2025, that figure had grown to roughly $416 billion. The pace continues to climb: the five companies are projected to spend about $724 billion this year and nearly $900 billion next year. The capital expenditures pay for data centers, the computer chips inside them, and the equipment and power to run it all. The companies leading the buildout are reporting record earnings and growing backlogs, and many say they're limited more by how fast they can build than by demand.
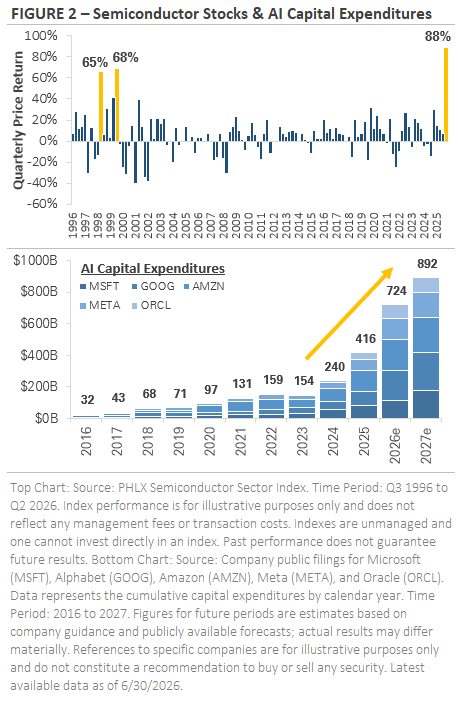
The surge in spending is also reshaping financial markets. Private companies are going public to fund their spending, while public companies are turning to debt and equity markets to finance their buildout. SpaceX completed the largest IPO in history during Q2, raising $85 billion. Other well-known private companies, including OpenAI and Anthropic, are expected to follow over the next year. In the public market, companies such as Alphabet and Oracle are issuing both stock and bonds to fund their spending. The amount of money being raised, and the spending plans behind it, point to a buildout that is still expanding.
A move of this size, both the spending and the share price gains, is historic. The market is treating AI as a major technological shift, and the quarter brought increased spending and earnings growth, with companies signaling more spending ahead. At the same time, a quarter like this shows how much future growth is already priced in. The closest historical parallel, the late 1990s, points to what rapid transformation tends to bring: both real opportunity and high expectations.
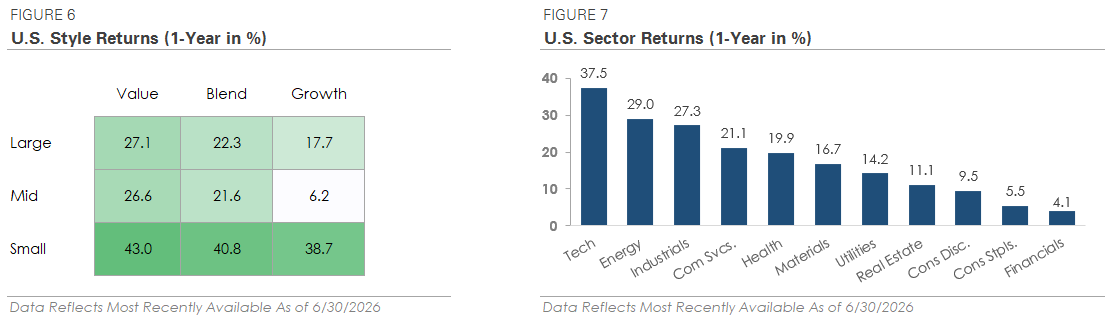
Beneath the headline rally in tech, Q2's gains were broad. Figure 3 compares year-to-date returns across the market. The S&P 500 has gained +10.2% this year, but strip out the tech sector and that falls to +5.1%, an indication of how much of the index's return has come from a single sector. The remaining market segments in the chart produced double-digit returns, outperforming the S&P 500. The S&P 400, an index of mid-cap stocks, and international stocks have both returned approximately +17%, while the small-cap Russell 2000 has gained +22%. For most of the past few years, the stock market's gains were concentrated in a handful of mega-cap tech stocks. Market leadership has broadened this year, creating a more balanced market.
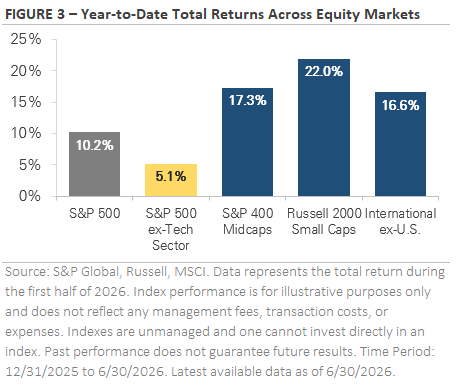
Several developments explain why the rest of the market has started to outperform. The first is profitability. Smaller companies' profit margins weakened in 2022 and 2023 as inflation spiked and the Federal Reserve raised interest rates. Small caps tend to carry more floating-rate debt, so as the Fed cut rates in recent years, the interest savings flowed to their bottom line. The second is the economy. Smaller companies are more sensitive to domestic economic conditions, so the economy's resilience has been a direct tailwind. There were concerns that this year's oil shock would weigh on the global economy like past oil crises. However, today's economy depends far less on energy than it did in the 1970s, and the impact has so far been relatively contained. The third is valuation. After years of tech stocks leading the market, smaller companies look cheaper by comparison, and their improving earnings have made that gap harder to overlook.
No single factor explains the shift, but together they make a fundamental case for why the gap has started to close. Profit margins are improving, the economy continues to expand, and parts of the market trade at valuation discounts. As this year has shown, holding a mix of company sizes, styles, and geographies means not depending on any single part of the market to do well.
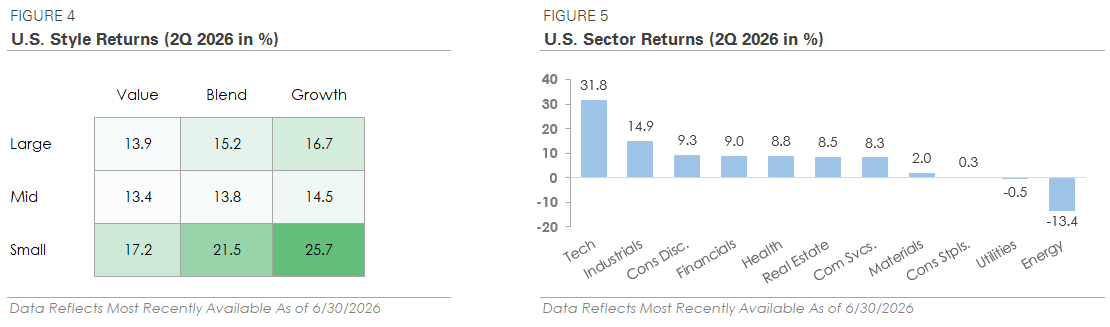
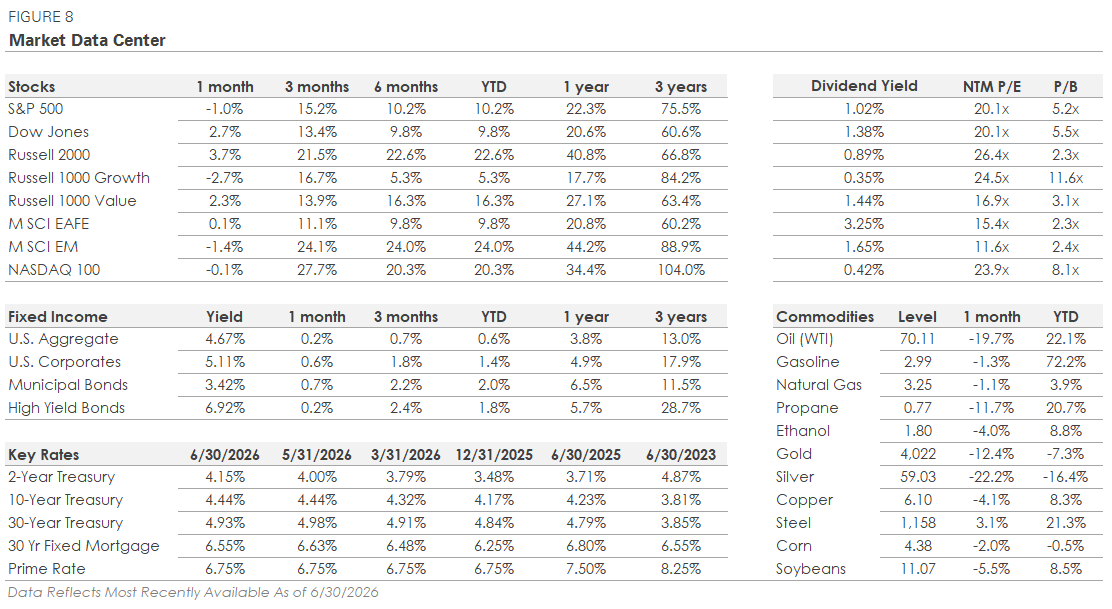
Equity markets traded higher throughout the quarter, with most of the advance coming in April as stocks rebounded from their late-March lows. The strength carried into May, with the S&P 500 posting a nine-week winning streak into month-end. The index set a record high in early June before giving back some ground to finish up +15.2%, its strongest quarter since Q2 2020, the early stages of the pandemic recovery. The Nasdaq gained +27.7% as tech stocks led the market rally, while the Dow rose +13.4%. As mentioned in the prior section, market breadth remained strong during the quarter. Smaller companies outperformed most major indexes in Q2, with the Russell 2000 gaining +21.5%.
From a sector perspective, nine of the eleven S&P 500 sectors finished higher. However, technology was the only sector to outperform the broad index, with a gain of +31.8%. Of the remaining sectors, Industrials, Consumer Discretionary, and Financials each rose +9% or more, while defensive sectors such as Utilities and Consumer Staples were flat. Energy was the only sector to trade lower, falling -13.4% as oil prices returned to pre-conflict levels.
International markets advanced alongside U.S. stocks, with the same divide between tech stocks and the rest of the market showing up overseas. Emerging markets gained nearly +24.1%, as Asian markets like South Korea and Taiwan benefited from the same semiconductor rally as in the U.S. Developed markets gained +11.1% but trailed both emerging and U.S. stocks due to their lighter tech exposure.
The bond market had another volatile quarter as interest rates tracked the path of oil. Treasury yields rose early during the quarter as oil prices remained elevated and the odds of a rate cut weakened, then reversed lower in June as energy prices declined and the inflation outlook improved. The 30-year Treasury was especially volatile, rising to its highest level since 2007 over concerns about oil, inflation, and a Federal Reserve leaning toward higher rates. Shorter-term yields, which are the most sensitive to Federal Reserve policy, also increased over the quarter as the market priced out additional rate cuts and began to weigh the possibility of a rate hike.
By the end of the quarter, the volatility had eased and yields stabilized. The Bond Aggregate, a broad index of U.S. investment-grade bonds, returned +0.7% for the full quarter. Corporate bonds outperformed during Q2, with high-yield gaining +2.4% and investment-grade returning +1.8%. Credit spreads, which measure the difference in yield between corporate and government bonds, retightened after widening in the spring as oil prices rose. Overall, credit spreads remain tight by historical standards, signaling continued confidence rather than concern. The one exception is the lowest-quality corner of the high-yield market, where CCC-rated bonds haven't recovered to pre-conflict levels, an indication of some caution toward the weakest borrowers.
Stocks ended Q2 near all-time highs as they rebounded from the volatility earlier this year. The conflict behind that volatility isn't fully resolved, but oil prices have fallen back to pre-conflict levels. There were concerns the oil spike would slow the global economy, like past energy crises, but the economy has held up so far with few signs of significant stress. What's left is a set of open questions: the path of oil and inflation, the durability of the AI investment cycle, and whether the market's broadening continues. The remainder of this year will be shaped by how each plays out.
The first is the path of inflation and interest rates. With oil back near where it started, inflation is widely expected to ease. The question is whether the cooling shows up in the coming inflation reports. If it does, it would take some pressure off the Federal Reserve. If inflation remains elevated, the Fed's cautious stance is likely to persist, with a rate hike on the table. The next few inflation reports will go a long way toward answering what the Fed does next.
The second is the AI buildout. The spending behind it has been enormous, and the gains in the stock market have been big. The question now is whether both can hold. The AI trade has become popular, and the late-quarter pullback in technology showed how quickly stock prices can swing when expectations are high. Over time, the spending will need to translate into real profits to justify the scale, especially as a growing share of it is funded by issuing new debt and stock. The past quarter showed the promise of the technology and served as a reminder of how much is already expected of it.
The third is whether the market's broadening continues. This year has been unique, with broad participation across the market existing alongside narrow leadership at the very top. Most sectors and company sizes have participated in the stock market rally, even as a small group of technology stocks has driven the largest share of the returns. The question is whether the gains keep spreading or leadership narrows again to a handful of names.
A list of open questions can naturally create some unease, so it's worth looking at how the past quarter unfolded. The market faced a war, an energy shock, inflation at a three-year high, and a Federal Reserve signaling a potential rate hike. Through all of it, stocks not only held their ground but traded to new highs. We can't know exactly how the questions will resolve, but a diversified portfolio and a long-term perspective can help navigate periods of uncertainty.
Views expressed are as of the date indicated, based on the information available at that time, and may change based on market or other conditions. Investment decisions should be based on an individual's own goals, time horizon, and tolerance for risk. Investing involves risk, including risk of loss. Investment advisory services provided by Provident Financial Planning, LLC, an SEC-Registered Investment Advisor.
The information and opinions provided herein are provided as general market commentary only and are subject to change at any time without notice. This commentary may contain forward-looking statements that are subject to various risks and uncertainties. None of the events or outcomes mentioned here may come to pass, and actual results may differ materially from those expressed or implied in these statements. No mention of a particular security, index, or other instrument in this report constitutes a recommendation to buy, sell, or hold that or any other security, nor does it constitute an opinion on the suitability of any security or index. The report is strictly an informational publication and has been prepared without regard to the particular investments and circumstances of the recipient.
Past performance does not guarantee or indicate future results. Any index performance mentioned is for illustrative purposes only and does not reflect any management fees, transaction costs, or expenses. Indexes are unmanaged, and one cannot invest directly in an index. Index performance does not represent the actual performance that would be achieved by investing in a fund.
Subscribe to receive the latest blog posts to your inbox every week.
Explore our expertly curated articles offering deeper knowledge and understanding on a range of financial topics.
Guided by our values of faith, service, and transparency, we at Provident Financial Planning are ready to help you navigate your financial journey. Schedule a consultation with us and discover how we can create a personalized financial plan for you.