For most of the past two decades, investors seeking higher returns had to rely more heavily on stocks. After the 2008 financial crisis, the Federal Reserve kept interest rates extremely low to support the economy, which meant Treasury bonds offered relatively little income. While stocks carried more risk than bonds, they offered earnings growth, dividends, and higher potential returns. The low-interest-rate environment helped popularize the phrase “There Is No Alternative,” or TINA, because bonds weren’t competitive as a source of return. However, the trade-off has changed in recent years. The 10-year Treasury now yields nearly 5.1%, slightly below the S&P 500’s forward earnings yield of 5.3%. For the first time in more than twenty years, bonds offer a competitive alternative to stocks.
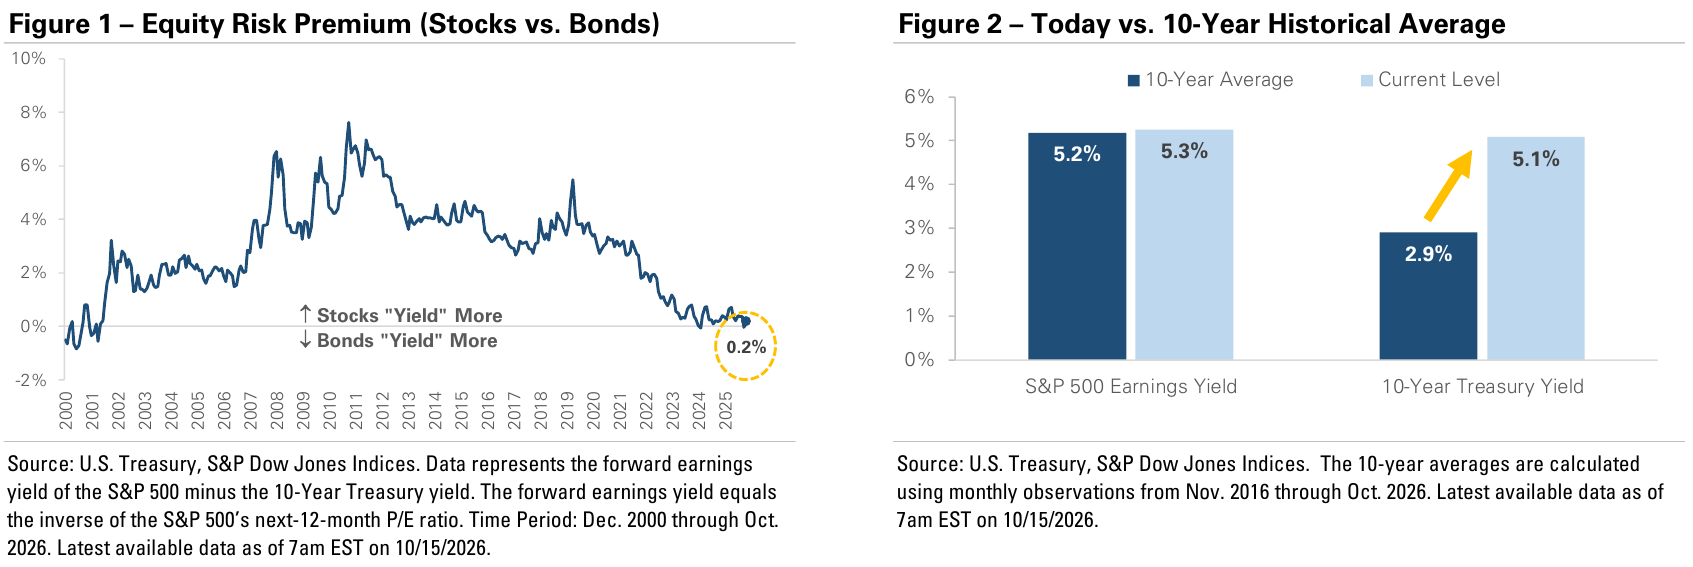
Figure 1 compares the 10-year Treasury yield with the S&P 500’s earnings yield. Because stocks don’t pay a fixed rate of interest like bonds, the earnings yield provides a way to compare stocks and bonds. The earnings yield shows how much profit S&P 500 companies are expected to generate relative to their market value. For example, a 5.3% earnings yield means S&P 500 companies are expected to generate about $5.30 of earnings for every $100 of market value. When the line in Figure 1 is above zero, the stock market’s earnings yield is higher than the 10-year Treasury yield. When it falls below zero, Treasury yields are higher than the earnings yield. For most of the period since the early 2000s, stocks held a sizable yield advantage. Today, the advantage is much smaller.
Figure 2 shows that the shift has come almost entirely from higher Treasury yields. The S&P 500’s current forward earnings yield of 5.3% is slightly higher than its 5.2% average over the past decade. In contrast, the 10-year Treasury now yields around 5.1%, 2.2 percentage points above its 10-year average of 2.9%. Treasury yields started rising in 2022 as the Federal Reserve aggressively raised interest rates to bring inflation under control. More recently, Treasury yields have remained elevated as investors weigh persistent inflation, the possibility of additional Fed rate hikes, growing federal deficits, and heavy government borrowing.
The charts don’t necessarily signal that bonds will outperform stocks, and higher Treasury yields come with their own risks. Bond prices can fall when interest rates rise, and inflation can reduce the purchasing power of the income that bonds provide. Stocks also offer the potential for corporate earnings to grow over time, which is one of the main reasons investors own them for long-term growth. The broader takeaway is that investors have more choices today. For years, low bond yields pushed many investors to rely on stocks to generate higher returns. Today, higher starting bond yields offer a competitive source of return and give investors more flexibility to balance income, growth, and risk across their portfolios.
Important Disclosures
Views expressed are as of the date indicated, based on the information available at that time, and may change based on market or other conditions. Investment decisions should be based on an individual’s own goals, time horizon, and tolerance for risk. Investing involves risk, including risk of loss. Investment advisory services provided by Provident Financial Planning, LLC, a SEC-Registered Investment Advisor.
The information and opinions provided herein are provided as general market commentary only and are subject to change at any time without notice. This commentary may contain forward-looking statements that are subject to various risks and uncertainties. None of the events or outcomes mentioned here may come to pass, and actual results may differ materially from those expressed or implied in these statements. No mention of a particular security, index, or other instrument in this report constitutes a recommendation to buy, sell, or hold that or any other security, nor does it constitute an opinion on the suitability of any security or index. The report is strictly an informational publication and has been prepared without regard to the particular investments and circumstances of the recipient.
Past performance does not guarantee or indicate future results. Any index performance mentioned is for illustrative purposes only and does not reflect any management fees, transaction costs, or expenses. Indexes are unmanaged, and one cannot invest directly in an index. Index performance does not represent the actual performance that would be achieved by investing in a fund.
Subscribe to receive the latest blog posts to your inbox every week.
Explore our expertly curated articles offering deeper knowledge and understanding on a range of financial topics.
Guided by our values of faith, service, and transparency, we at Provident Financial Planning are ready to help you navigate your financial journey. Schedule a consultation with us and discover how we can create a personalized financial plan for you.